Solution Builder
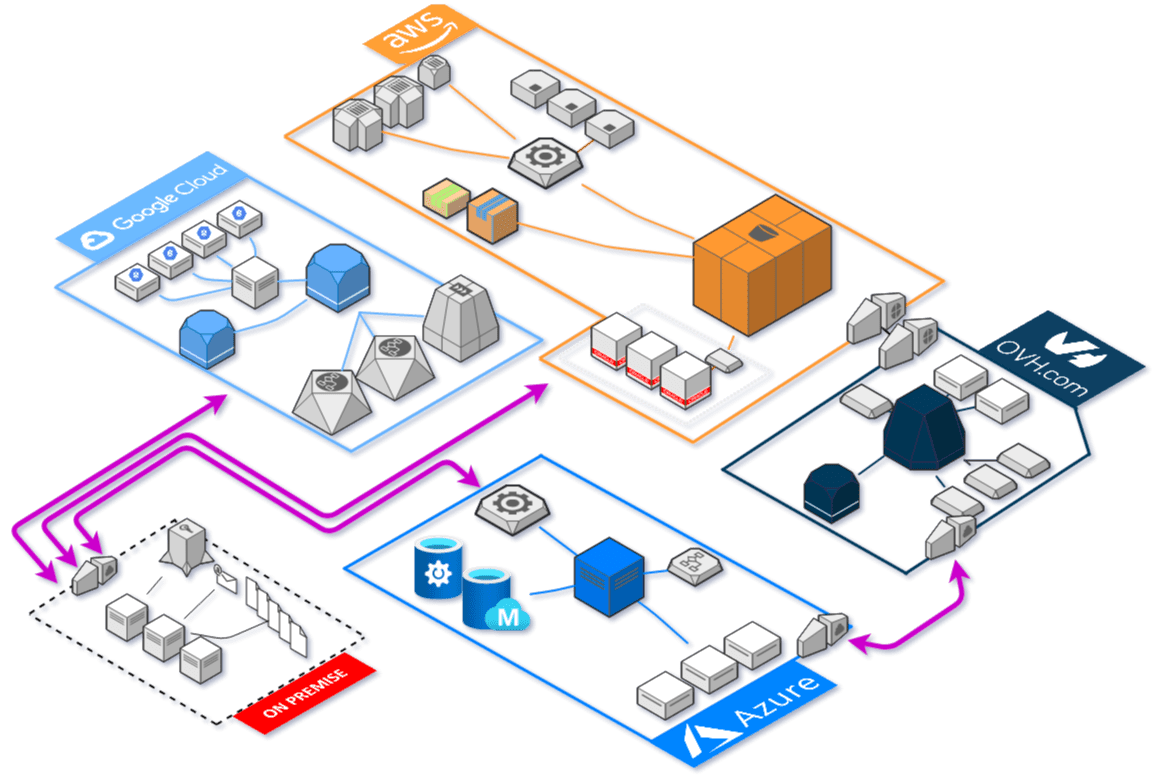
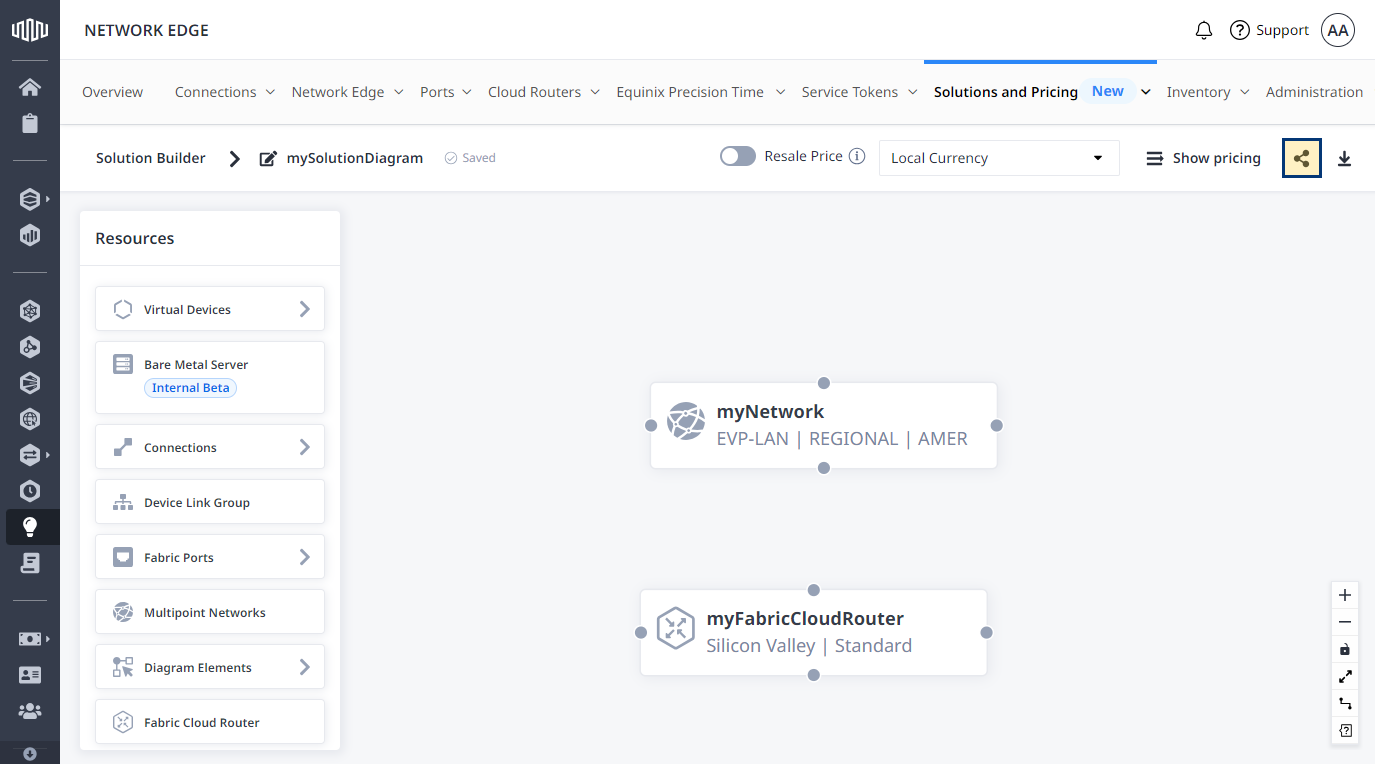
In a world where Network architects and GSAs struggled with disconnected tools and complex workflows, our team envisioned Solution Builder—a seamless platform to design, quote, and deploy network solutions in real-time.
Fueled by deep user research, including interviews, kano surveys, document analysis and iterative concept testing, we uncovered pain points and transformed them into intuitive features. Post-launch, data-driven insights from Amplitude and validation tools revealed opportunities for refinement, ensuring the platform continually evolves. Upon launch, solution Builder shortened the pre-sales time for Solutions Architects, and increased revenue for company.

Methods
Phase 1: Stakeholder Interviews, Customer Interviews, Jobs-to-Be-Done workshops
Phase 2: Kano Survey
Phase 3: Iterative Concept Testing with Solution Architects, and Customers
Phase 4: Post launch Interviews with Solution Architects and Customers
Phase 5: Clickstream analysis, and Funnel Analysis
Responsibilities (UX Research)
Role: I was the lead researcher for this project. I proposed, designed, and executed all research activities,
along with providing input to the design, and product teams throughout this process.
Team (Phase 1, 2, and 3)
Researcher - Karthik Srinivasan (Me)
Designers - Richa Kulkarni, and Elnaz Doostdoor
Project Manager - Monica Sharma
Product Director - David McCullough, and Darya Taheri
Team (Phase 4 and 5 )
Researcher - Karthik Srinivasan (Me)
Designer - Richa Kulkarni
Product Managers - Sachin Rao, Mitts Sagae, Dilip Gangadariah
Key Personas
GSAs (Global Solutions Architects): Product experts with solution design expertise.
Customers: Network Engineers, Architects, and Admins with varying levels of Equinix product familiarity
The Problem - An Incomplete Journey
Imagine you're a network architect tasked with designing and deploying a global connectivity solution. You juggle spreadsheets, diagramming tools, and back-and-forth communication to piece together a solution. Equinix’s product ecosystem, though rich, lacked a unified tool for designing, ordering, and provisioning solutions seamlessly. Customers and Global Solutions Architects faced challenges like disconnected workflows, limited visibility into product capacities, no visibility of pricing information, and cumbersome diagramming processes.
Our team saw this gap as an opportunity to create Solution Builder—a "single pane of glass" tool that could transform how customers and GSAs designed and deployed their networks.
The Vision: A Seamless Solutioning Tool
Our goal was ambitious yet clear - build a platform that allows our customers and GSAs to:
Design: Leverage intuitive tools to create network diagrams.
Order: Select from Equinix’s offerings with full pricing transparency.
Provision: Streamline deployment with real-time guidance and smart recommendations.
But we knew this vision couldn’t come to life without a deep understanding of the users who would rely on it daily.
The Research Journey (Phase 1 to 3): From Exploration to Validation
Phase 1: Generative Research - Setting the foundation
Through interviews with 8 GSAs and 12 customers and Jobs-to-Be-Done workshops with 9 stakeholders, we unearthed key needs:
Both GSAs and customers wanted better planning and tracking of existing assets
GSAs sought smarter tools for collaboration and diagramming
Customers expected contextual help, latency metrics, and clear pricing
We distilled these insights into an initial feature list. But the question remained: which features mattered most?
Phase 2: Feature Prioritization – The Kano Survey
To prioritize effectively, we ran a Kano survey with 31 GSAs. The results revealed:
Must-haves: Pricing/quoting tools, visibility into existing deployments, and latency metrics
Nice-to-haves: Collaboration features, onboarding tutorials, and customizable templates
This prioritization became the foundation of our design strategy.
Phase 3: The Iterative Process: Learning Through Testing
With the findings from the study insights and recommendations from phase 1 and 2, our designers put together an initial solution builder prototype. With the prototype in hand, we embarked on an iterative design and validation journey.
Round 1: GSA Concept Testing
We tested early prototypes with 6 GSAs. Their feedback was candid:
The map view was overwhelming, requiring a simpler, higher-level overview.
The topology view was promising but needed reordering to align with GSA workflows
We refined the design by introducing a Metro-level abstraction in the map view and reorganizing components in the topology view. These changes made navigation and diagramming significantly more intuitive.
Round 2: Customer Concept TestingNext, we engaged 7 customers (Network Engineers, Network Architects, Admins) with varying expertise levels. Their reactions were polarized:
Experienced users found the tool empowering, enabling them to quickly design solutions
Novice users struggled, needing more guidance and simplified workflows
These insights underscored the need for two distinct user flows: guided onboarding for novices and an exploratory mode for experts.
Shipping the Solution Builder: A Promising Beginning
In 2022/23, the Solution Builder was shipped with high expectations. Thanks to iterative feedback and user-driven refinements, the launch was met with great reception from GSAs and customers alike:
GSAs found the tool to be an invaluable addition to their workflow, enabling them to solution and quote directly in real-time calls with customers
Customers appreciated how the tool simplified their solutioning processes, especially with enhanced topology views and intuitive navigation
Despite its success, we knew the journey wasn’t over. Post-launch research became crucial to identify areas of further improvement and gather feedback from users actively engaging with the tool.
Post-Launch Feedback (Phase 4): Learning from the Field
Three months after the launch, we conducted Solution Builder interviews with 7 GSAs and 8 customers (Network Engineers, Network Architects, Admins) to assess its impact and explore areas for enhancement
Key Questions Explored (Phase 4 - Interviews):
What’s working well in the current tool?
GSAs praised the pricing tool as the Solution Builder’s biggest USP, enabling them to generate accurate quotes in real-time
The ability to solution in the first customer call saved significant time in the sales cycle, reducing dependency on external tools like Lucidchart
What are the pain points?
Searching for saved diagrams was cumbersome, requiring precise filenames and lacking robust filters
Connecting two assets was finicky, as the interface demanded precise placement of lines to establish connections
Missing existing topology import limited adoption for certain use cases, forcing some GSAs to revert to older tools
What could be improved?
Enhanced diagramming elements like separators, grouping tools, and labels were frequently requested
GSAs suggested adding filters, tags, and version control for diagrams to make collaboration smoother
Greater onboarding support, including video tutorials and guided tours, was recommended to improve adoption among new users
Iterative Improvements Post-Launch
Using this feedback, we launched several updates to enhance the Solution Builder:
Improved Connections: Increased connection dot sizes and introduced snapping functionality for smoother asset linking
Diagram Enhancements: Added grouping tools, labels, and separators to organize assets visually
Saved Layouts: Implemented a feature to preserve canvas zoom and layout for a more consistent user experience
Onboarding Updates: Introduced a first-time user experience tour and an announcement modal to highlight new features
GSAs reported that these changes significantly improved their experience, making the tool feel more intuitive and powerful over time.
Using Data to Drive Enhancements (Phase 5): Monitoring with Amplitude
As Solution Builder adoption grew, our focus shifted toward leveraging data-driven insights to understand how users engaged with the tool in real-world scenarios.
Tracking Customer Behavior
To ensure we continuously refined the user experience, we utilized Amplitude to monitor:
Click Interactions: Every interaction, from adding nodes to adjusting topology, was tracked to identify friction points and optimize workflows.
Customer Journey Funnels: We analyzed how users navigated key paths, such as transitioning from the topology view to viewing quotes, and pinpointed where users dropped off.
Action Frequency: Metrics like how often specific features were used helped us understand feature relevance.
Solution Validation Center Tool
Additionally, we monitored solution diagrams saved and shared through the Solution Validation Center Tool, gaining insights into:
Diagram Complexity: Patterns in how users constructed their solutions, such as asset grouping or redundant connections.
Workflow Gaps: Recurring configurations that indicated missing features or automation opportunities.
Ultimately, this data-driven approach ensures that Solution Builder doesn’t just meet expectations but continuously evolves to exceed them
The Outcomes: Tangible Impact
By the end of our research, the Solution Builder had evolved into a robust tool with:
Simplified navigation through a Metro-level map view.
Reorganized topology diagrams tailored to user workflows.
Enhanced diagramming tools with separators, labels, and grouping options
GSAs reported saving two days per project during pre-sales calls. Customers praised the tool for its ability to streamline solutioning and improve efficiency
Reflections and Learnings: What We Discovered
Through this journey, we learned:
Empathy is essential. Novice users and experienced GSAs have vastly different needs, and a one-size-fits-all solution won’t work.
Iterative testing drives innovation. Each round of feedback sharpened our focus and improved the product.
Small changes, big impact. Features like tooltips, clearer connection mechanics, and layout preservation dramatically improved usability
Epilogue: Building an End-to-End Experience
From scattered workflows to a cohesive platform, the Solution Builder embodies the power of research-driven design. It’s more than a tool; it’s a testament to the value of listening to users, iterating with purpose, and bridging the gap between complexity and simplicity.
This is just one chapter in my journey with Equinix toward creating customer-centric solutions. There are many more - just ask me!